News · Heart & Metabolic
Glucose monitor patterns tracked with heart risk in 1,356 people who did not have diabetes
A fasting blood sugar test is a single moment. Framingham Heart Study participants wore continuous monitors for up to 10 days, and the fuller picture lined up with cardiovascular risk that standard tests missed.
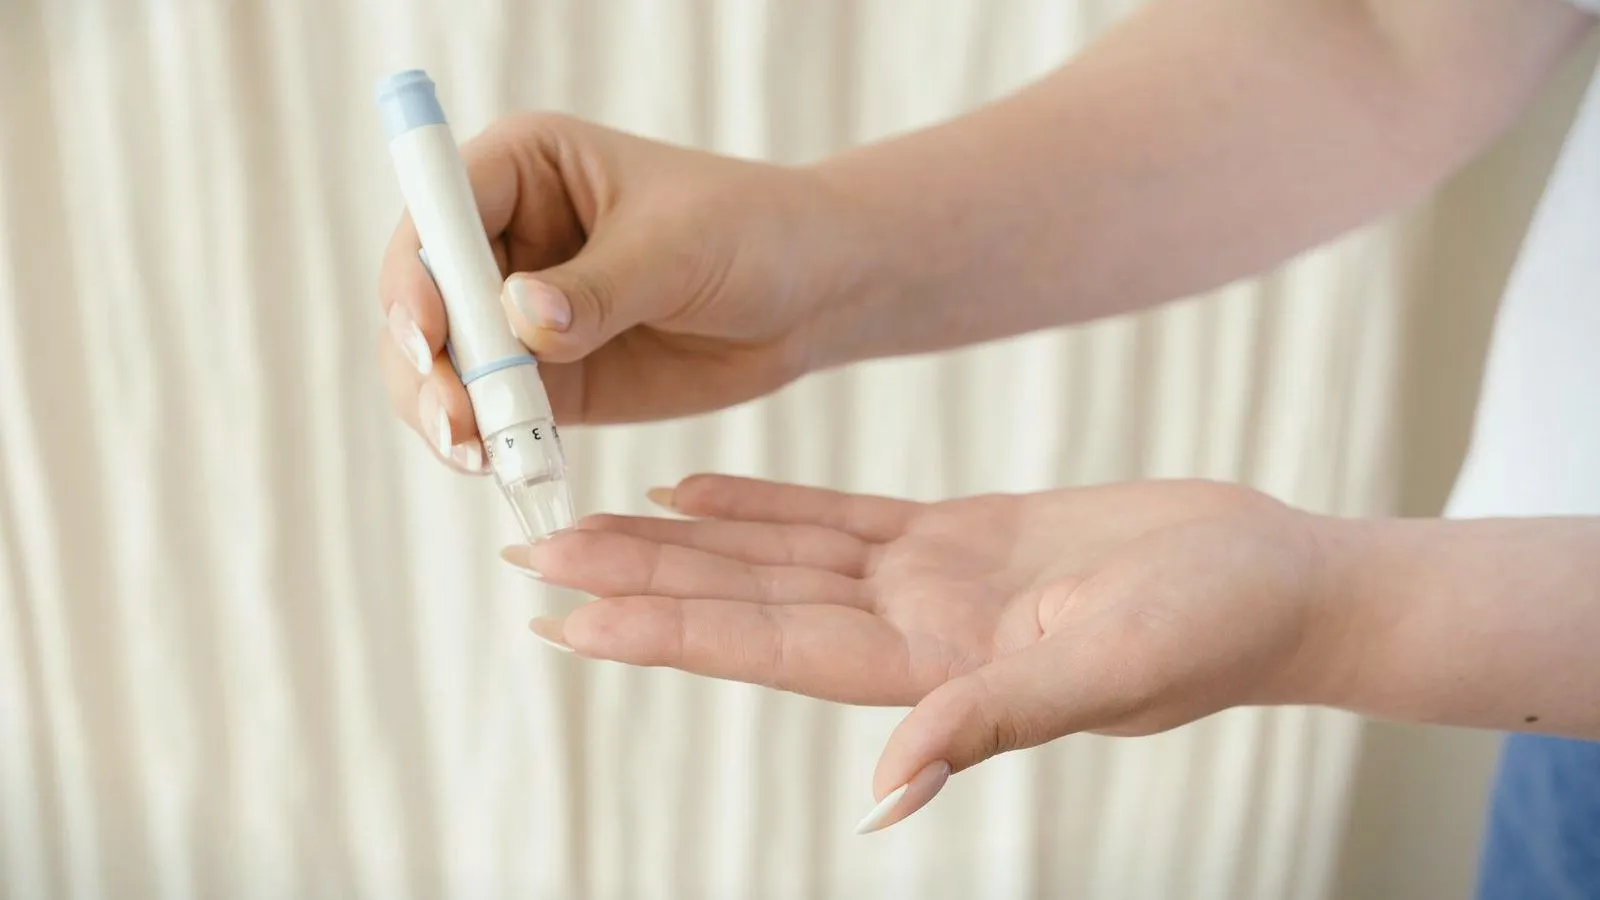
- This study measured 1,356 adults without diabetes or heart disease at a single point in time.
- They wore a blinded continuous glucose monitor for up to 10 days.
- More time spent above 140 mg/dL went with higher estimated 10-year heart risk.
- It also went with higher odds of high blood pressure and abnormal cholesterol.
- Monitor patterns often disagreed with who counted as prediabetic on standard tests.
Glucose monitors have escaped the diabetes clinic. They are now sold to people with no diagnosis at all, promising insight into which foods spike your blood sugar. Whether any of that tells you something useful about your health has been largely untested, which makes a study of 1,356 Framingham Heart Study participants worth reading.
Everyone in it wore a monitor for up to 10 days without being able to see the readings. The patterns those monitors recorded lined up with cardiovascular risk, including in people whose standard blood tests looked fine.
Why isn’t a fasting blood sugar test enough?
The two standard measures are a snapshot and an average. Fasting plasma glucose is one reading, taken after not eating overnight. Hemoglobin A1c reflects roughly the previous three months, but as a single number.
Neither captures what glucose actually does across a day: how high it climbs after meals, how long it stays there, how much it swings. The authors argue those standard tests may not fully capture the heterogeneity underlying dysglycemia, the general term for blood sugar that is not behaving normally.
How was the glucose monitor study designed?
The researchers took 1,356 participants from the Framingham Heart Study, the long-running US cohort, all of them free of diabetes and cardiovascular disease. Each wore a blinded Dexcom G6 Pro monitor for up to 10 days.
Blinded matters. Because participants could not see their readings, they had no reason to change what they ate, so the monitor captured ordinary life rather than a person experimenting with breakfast.
The team then compared the monitor data against each person’s estimated 10-year risk of cardiovascular disease, calculated with a standard set of equations called PREVENT, and against individual risk factors such as blood pressure and cholesterol. Two approaches were used: sorting people by how much time they spent high and how variable their glucose was, and letting an algorithm group similar patterns together.
What did the monitor patterns line up with?
Higher glucose measures went with higher estimated heart risk and worse risk factors across the board. The example the authors give is concrete: one standard step up in the share of the day spent above 140 mg/dL of glucose, a common after-meal threshold, which worked out at about 15.4%, went with 2% higher 10-year risk estimates and 21 to 26% higher odds of high blood pressure and abnormal cholesterol.
Crucially, that held even after adjusting for fasting glucose. In other words, the monitor was adding information that the standard test had not already captured.
Why did the monitors disagree with prediabetes labels?
This is the part with implications for how blood sugar gets diagnosed. The glucose profiles suggesting the most dysregulation did not map neatly onto who officially had prediabetes: between 48.1% and 84.2% of people with prediabetes by standard tests fell into the higher-dysglycemia profiles, meaning a substantial share did not.
Those higher-dysglycemia profiles came with 6 to 7% higher 10-year risk estimates and worse risk factors generally. So the monitors were picking out a group that standard categories miss, at least as far as risk factors go.
What can’t a one-time glucose snapshot show?
The central limitation is in the design: glucose and risk were measured at the same moment, with no follow-up. Nobody was followed to see who actually had a heart attack. The outcome here is a risk estimate produced by an equation, not an event.
That distinction matters because a risk estimate is built largely from blood pressure, cholesterol, age and diabetes status. Finding that glucose patterns correlate with a score partly made of related measurements is less surprising than finding they predict events.
The participants were also mostly older, average age 59, and 92.6% non-Hispanic White, so the numbers may not transfer to other groups. The paper is paywalled and its limitations section was not reviewed for this article.
Should you wear a glucose monitor if you don’t have diabetes?
This study cannot answer that, and it is careful not to claim otherwise. It shows that continuous glucose patterns carry information about cardiometabolic risk beyond standard tests. It does not show that a person who buys a monitor, sees their spikes and changes their breakfast ends up healthier.
If you are worried about your blood sugar, the route that is actually validated runs through a health care provider and standard tests. MedlinePlus explains that blood glucose is the main sugar found in your blood, your body’s primary source of energy, and that it comes from the food you eat. Wearing a sensor may make that abstraction feel vivid; whether it makes anyone healthier is still an open question.
People also ask
What did the study find?
Continuous glucose monitoring measures were positively associated with 10-year cardiovascular disease risk estimates and with cardiometabolic risk factors. One standard deviation higher percentage of time spent above 140 mg/dL was associated with 2% higher 10-year risk estimates and 21 to 26% higher odds of hypertension and dyslipidemia, even after adjusting for fasting plasma glucose. Profiles representing higher dysglycemia were discordant with traditionally defined glycemic status.
What is a continuous glucose monitor?
A small sensor worn on the skin that samples glucose in the fluid under it every few minutes, producing a curve rather than a single reading.
What does blinded mean here?
Participants could not see their own readings, so the monitor recorded their normal habits instead of prompting them to change what they ate.
What is 140 mg/dL?
A threshold above which glucose is considered high after eating. The study looked at what share of the day people spent above it.
Does this mean I should buy a glucose monitor?
It does not show that. This study measured everything at one point in time and did not follow anyone, so it cannot say whether wearing a monitor changes health.
How do I know if my blood sugar is a problem?
Standard tests, ordered by a health care provider, remain how diabetes and prediabetes are diagnosed. This is general information rather than medical advice.