News · Brain & Mental Health
Dementia deaths peak in the suburbs, not the city or country
A JAMA Network Open study following 40.9 million people in England found dementia mortality highest at middle population density, and neighborhood conditions explained most of the gap.
- 40,948,445 people across 32,844 English neighborhoods, followed a median 8.68 years.
- 621,756 deaths had dementia as the underlying cause.
- Mortality peaked at middle density, around 20 to 40 people per hectare, falling at both extremes.
- Neighborhood conditions explained at least 71% of that gradient, mostly services and outdoor environment.
- Observational, and the averted-deaths figures are model projections, not measured outcomes.
Ask where dementia kills most people and the intuition runs to one of two extremes: the isolated countryside, or the polluted inner city. A study in JAMA Network Open, published by the American Medical Association, followed nearly 41 million people in England. The answer sits awkwardly in between.
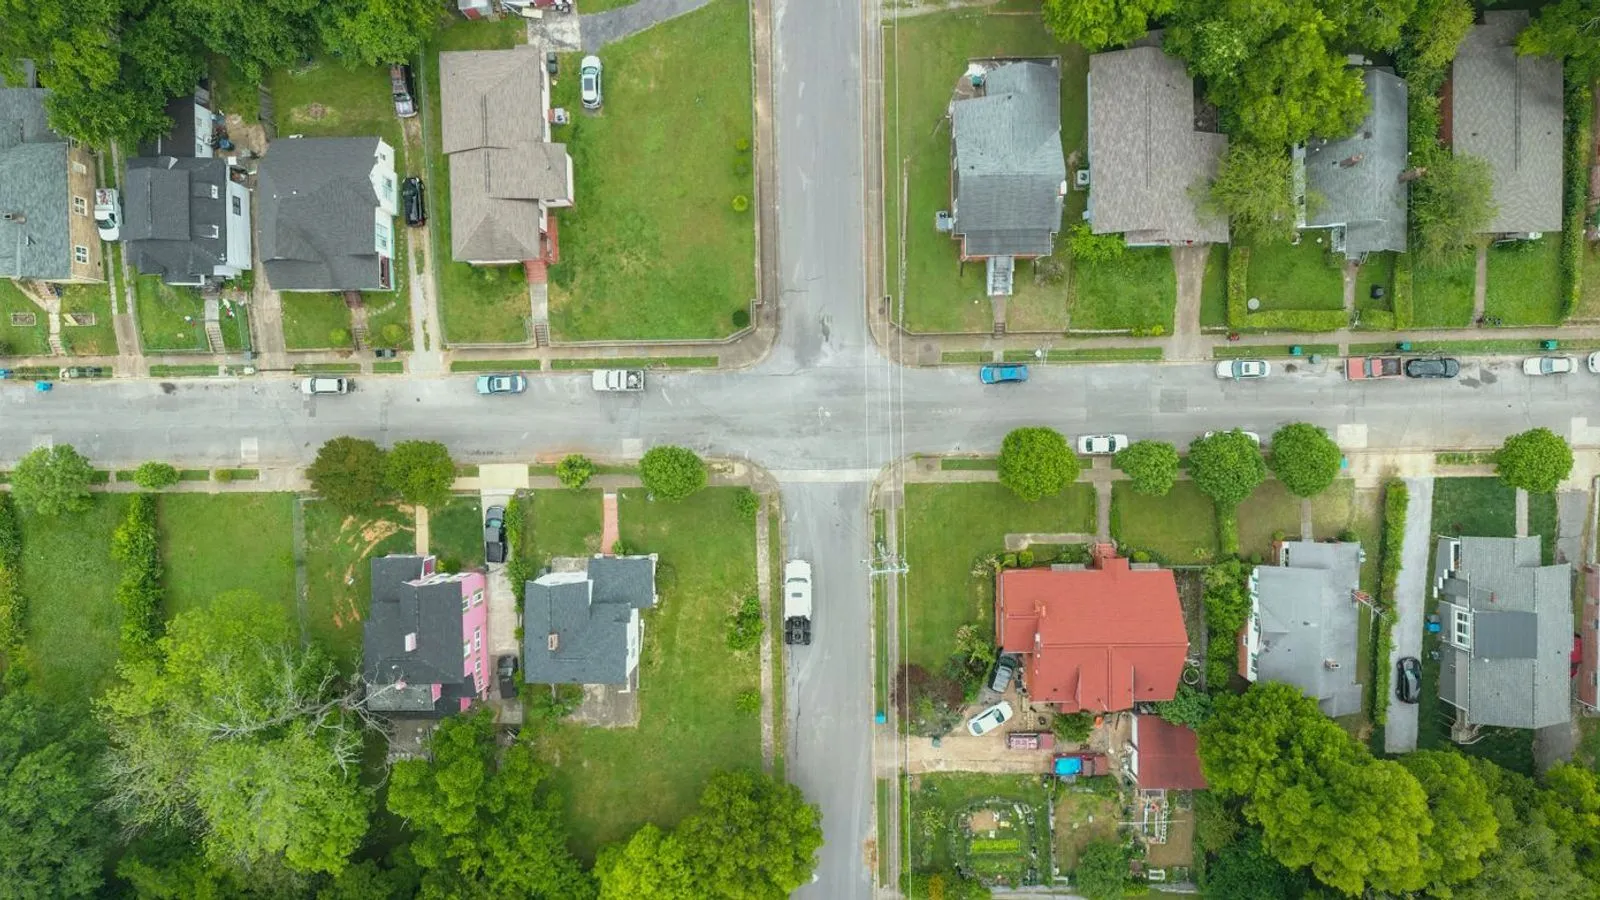
Dementia mortality showed a curvilinear inverted U-shaped association with urbanicity, peaking at mid-urbanicity and declining at both extremes. The suburbs, in other words.
The urbanicity question nobody had data for
Cities are growing denser, and populations older, at the same time. The authors set out the gap plainly: how dementia mortality varies across the urbanicity gradient and how neighborhood conditions contribute to this pattern remain unknown.
Answering it needs individual death records linked to fine-grained geography across an entire country, and until now it had not been done at this scale.
Forty million people, twelve years
The study used person-level mortality data linked to the national census across 32 844 lower super output areas in England from March 2011 to February 2023. Those areas are the small census units English statistics are built on, each covering roughly 1,500 people.
A total of 40 948 445 individuals, average age 46.9, were followed for a median of 8.68 years. There were 5 309 719 deaths, including 621 756 underlying-cause and 926 502 any-mention dementia deaths.
Urbanicity was measured simply as neighborhood population density in persons per hectare, alongside seven neighborhood conditions covering income, employment, education, crime, living environment, housing, and service accessibility.
Why neighborhood conditions dissolved the pattern
The inverted U held up across subgroups, dementia subtypes, and all-cause mortality, which makes it unlikely to be a quirk of how dementia is coded.
Then the researchers did the thing that turns a curiosity into a finding. Adjusting for all factors largely eliminated the gradient, with at least 71% attenuated, and accessibility and living environment contributing the most.
The density itself was mostly a proxy. What tracked with dementia deaths was whether a neighborhood had services within reach and a decent outdoor environment. Mid-density areas are where both are most often thin.
Putting a number on the fix
The final step models what improvement might buy. Shifting both service accessibility and outdoor living environment from the lowest fifth to the second estimated 65 572 dementia deaths averted, a 10.5% reduction.
Accessibility alone accounted for most of it, a 7.0% reduction, against 3.7% for living environment-only improvements.
Those gains were not evenly spread. Estimated gains were larger in males, adults aged 45 to 54 years, residents of private households rather than care homes, and Black residents.
What the dementia mortality data cannot show
This is observational, so the association between neighborhood conditions and dementia deaths is not proof that changing one changes the other. People with more resources sort themselves into better-served neighborhoods, and that sorting is hard to separate from the neighborhoods themselves.
The averted-death figures deserve particular caution. They come from parametric g-computation, a simulation that assumes the associations are causal and the improvements deliverable. That is a policy modeling exercise, not a measured result.
Mortality is also not incidence. Dying with dementia recorded reflects diagnosis rates and certification practice as well as disease.
What survives is a genuinely useful reframing. The authors conclude that targeted improvements in modifiable neighborhood conditions may substantially reduce dementia mortality and advance equity.
Dementia prevention is usually sold as a list of personal habits. This puts a large share of it in the hands of whoever decides where the bus stops go.
People also ask
Why would mid-density areas be worst?
The study documents the shape rather than fully explaining it, but its own analysis points at the answer: adjusting for neighborhood conditions removed most of the gradient. Dense urban cores tend to have good service access and amenities; rural areas have space and greenery. Mid-density suburbs can end up with the weaknesses of both, being car-dependent with fewer services within reach and less outdoor quality than open countryside.
Does moving to the city or countryside reduce dementia risk?
Nothing here supports that as personal advice. The density association mostly disappeared once neighborhood conditions were accounted for, which suggests it is the conditions doing the work, not the density itself. A well-served mid-density town would not carry the average risk of a poorly served one. This is a finding about planning and provision, not about where any individual should live.
How reliable is the '65,572 deaths averted' figure?
Treat it as a modeled scenario, not a measurement. It comes from parametric g-computation, a technique that simulates what would happen if an exposure changed while everything else held. It assumes the associations are causal and that the improvement could actually be delivered. Both assumptions are doing heavy lifting, so the figure is best read as an order of magnitude for policy discussion.
What counts as 'service accessibility' and 'living environment'?
They come from the UK's standard neighborhood deprivation indices. Service accessibility covers practical distance to things like shops, a GP, a post office and public transport. Living environment covers housing quality and the outdoor environment, including air quality and road safety. These were the two components that explained the most of the density gradient.
Is this about dying of dementia or getting dementia?
Dying of it. The primary outcome was mortality with dementia as the underlying cause, with a secondary outcome of dementia mentioned anywhere on the death certificate. That is a different question from incidence, and it can be shaped by diagnosis rates, care quality and how deaths are certified as well as by who develops the disease.